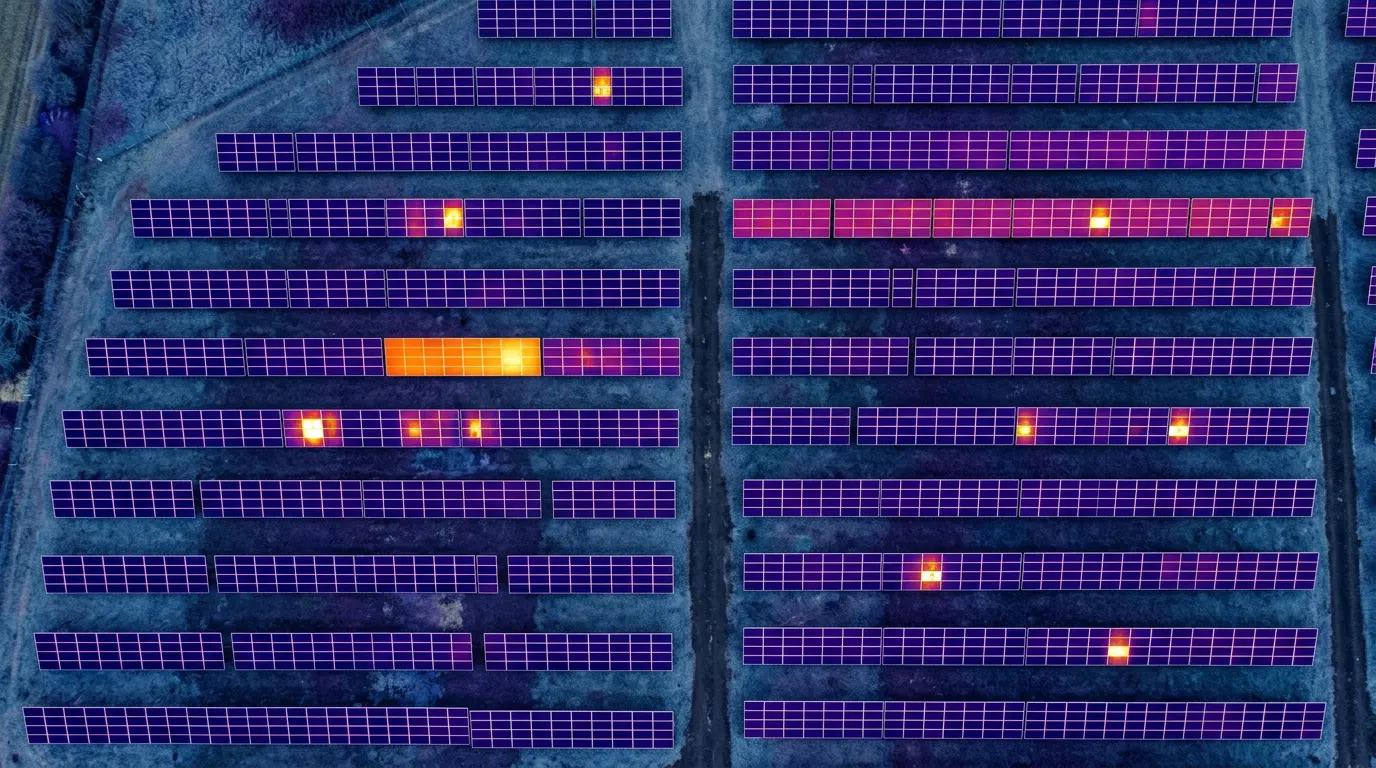
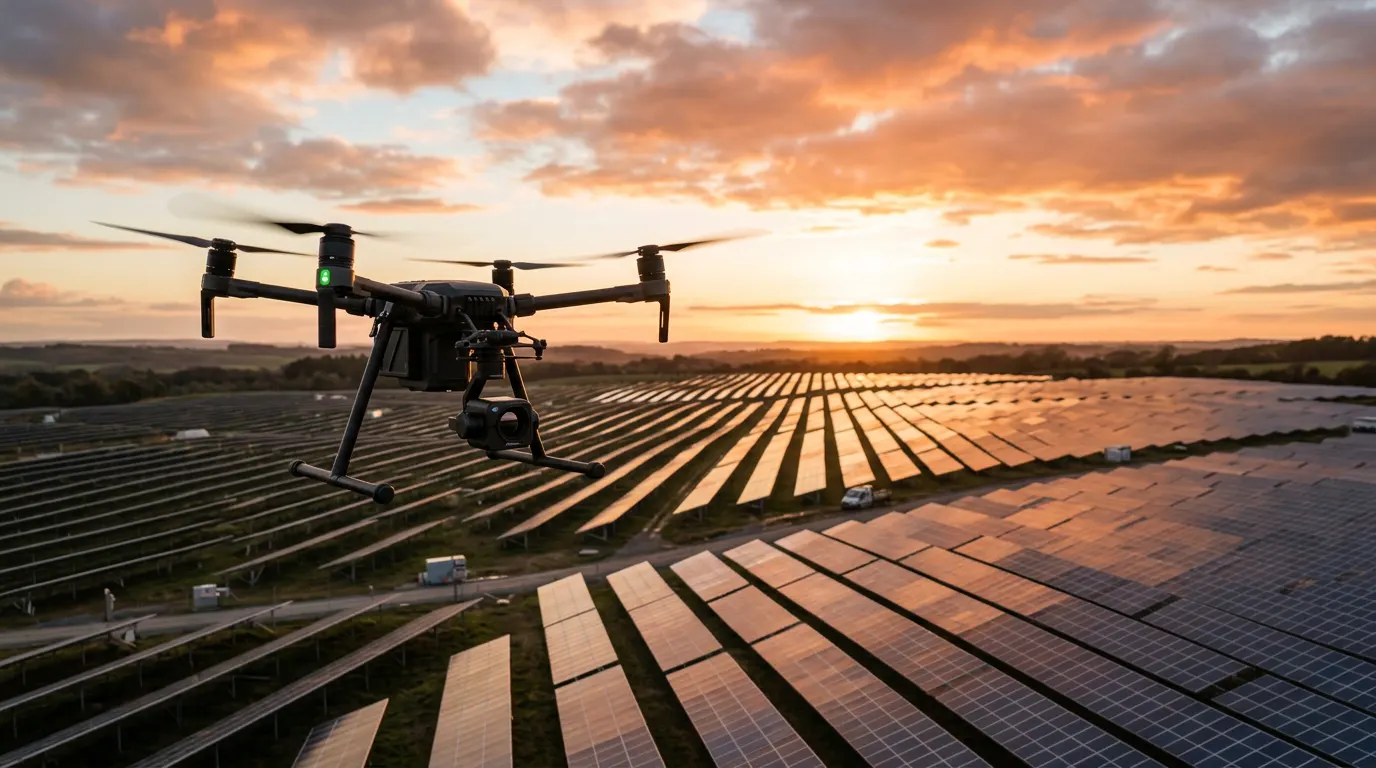
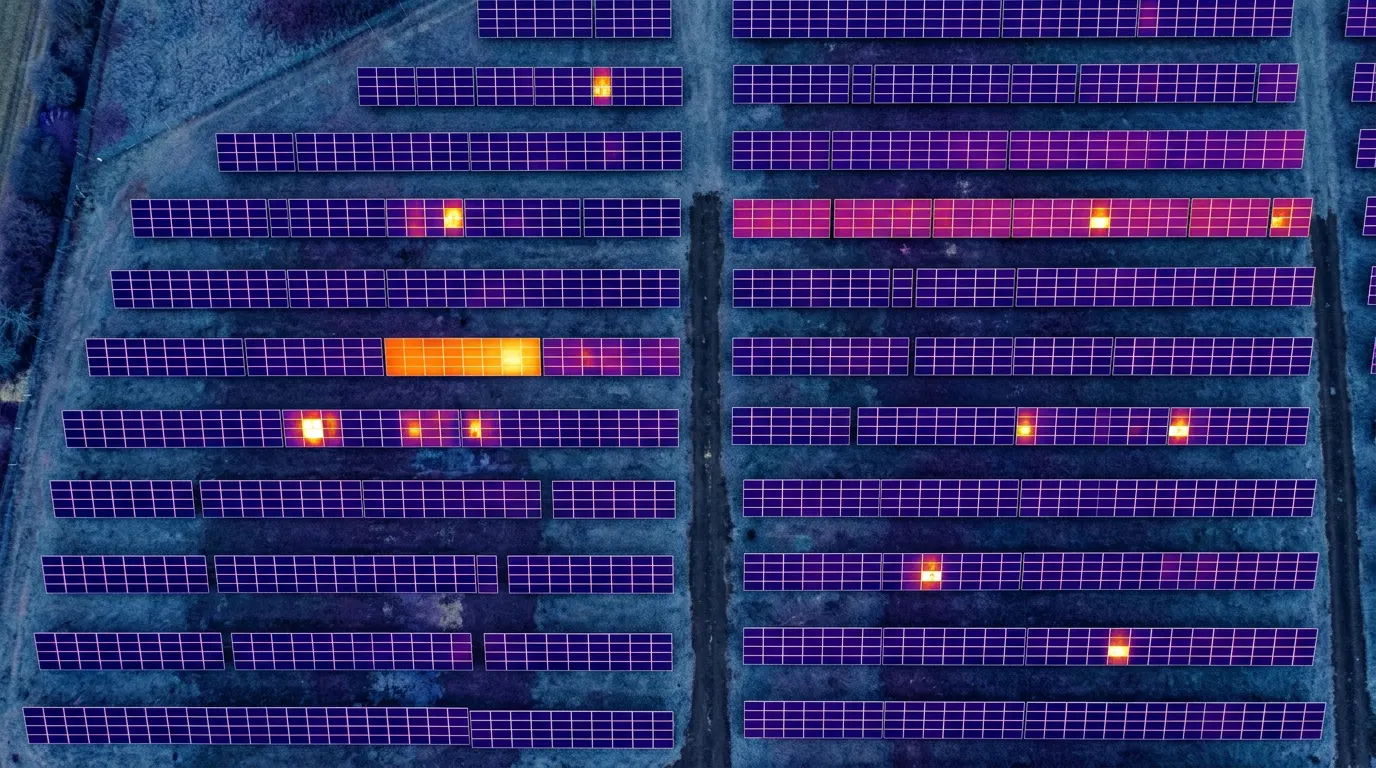
Thermal imaging drone flying over a solar farm at sunset

Drone infrared thermography

Is your investment underperforming?

Hotspots, failed diodes and dead strings are invisible from the ground — but they quietly drain your output every sunny day. Our drones see the heat your eyes can’t, and show you exactly where your money is leaking.

See what we find
Every
panel scanned
0
roof access needed
Panel-level
fault mapping
Res & Ind
sites covered

Your panels look fine.
That’s the problem.

What the eye can’t see, your power bill can. A standard visual check passes these arrays with flying colours. One thermal flyover tells a very different story.

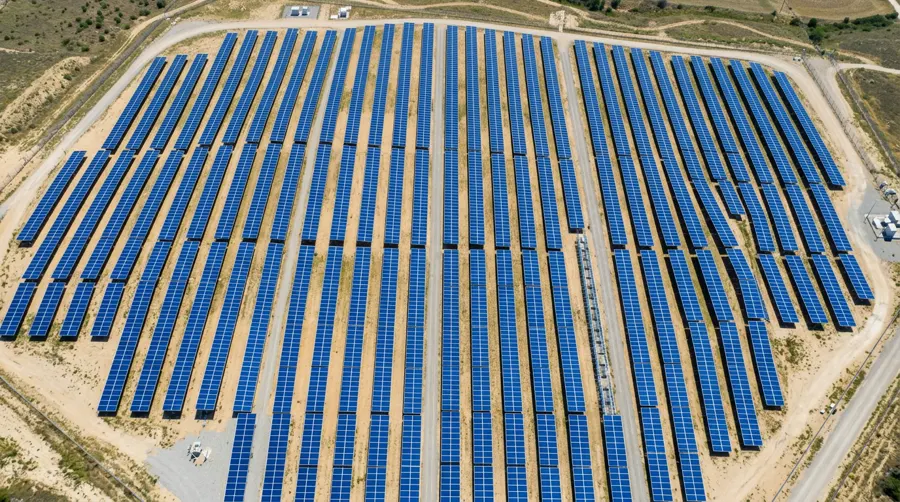
Solar array photographed in visible light, looking normal
What you see

Visual inspection result

“No issues detected.”

The same kind of array in infrared, revealing multiple hotspots
What our drone sees

5 anomalies flagged · tap a marker

CoolHot

Anomaly library

Hidden faults. Visible losses.

The cost of not knowing

Don’t let hidden heat burn through your returns.

A few faulty cells rarely trip an alarm. They just shave a few percent off every day — for years. Slide to estimate what undetected faults could be costing you.

Energy lost / year

1,120 kWh

Money lost / year

$314

Illustrative estimate assuming ~1,400 kWh generated per kW each year. Actual yield and losses vary by location, orientation and fault type.

Who we inspect

From the family home to the factory floor — see the heat, stop the loss.

Thermal drone image of a house roof with solar panels showing hotspots
Residential

Is your rooftop pulling its weight?

  • Confirm your system delivers what your installer promised
  • Spot fire-risk hotspots before they become a hazard
  • Documented evidence for warranty and insurance claims
  • No ladders, no one walking on your roof
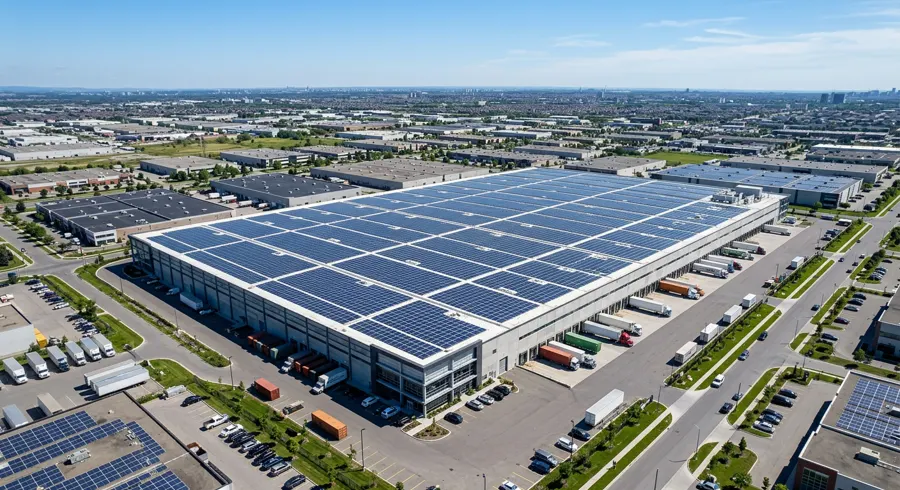
Aerial view of a warehouse roof covered in solar panels
Commercial & Industrial

Thousands of panels. Zero guesswork.

  • Inspect large rooftops and solar farms in hours, not weeks
  • Panel-by-panel fault map your O&M team can act on
  • Prioritised repair list ranked by severity and yield impact
  • Minimal disruption to operations — no shutdown required

How it works

Four steps to full visibility.

  1. 01

    Book your slot

    Pick a preferred day and time. We check the forecast for clear, high-irradiance conditions.

  2. 02

    We fly the site

    A licensed pilot flies a radiometric thermal drone over every panel — no roof access needed.

  3. 03

    We analyse the heat

    Every anomaly is located, classified and ranked by severity and likely yield impact.

  4. 04

    You get the report

    A clear report with thermal and visual images, locations and recommended next steps.

The sun is free. Lost output isn’t.

Stop guessing. Start seeing.

One flight can reveal months of hidden losses. Book your drone thermography assessment today.

Book an assessment

Let’s see what your panels are hiding.

Your details

Preferred inspection slot

Preferred time *

Thermography needs strong, steady sunlight. If the forecast turns cloudy we’ll reschedule with you.

We’ll be in contact via email or phone to confirm your inspection.